Climate of Hawaiʻi
This website provides a set of maps of the spatial patterns of climate for the major Hawaiian Islands. We estimated climate variables as part of a larger project on evapotranspiration. In that project it was necessary to map variables such as air temperature, relative humidity, solar radiation, net radiation, and many others. Those, along with evapotranspiration, are included here too. Most variables are mapped for each hour of the average 24-hour cycle of each month and for each hour of the average 24-hour cycle for the whole year. The average value for each month and the annual average are also mapped. Many of those maps are available via this website, in the form of downloadable files and, for a selection of variables, on the interactive mapping tool.
|
Be sure to check out the interactive map! It may need a few minutes to load on your first visit. |
Climate Variables
The following climate and land characteristic variables were mapped and are available through this website:
This Website
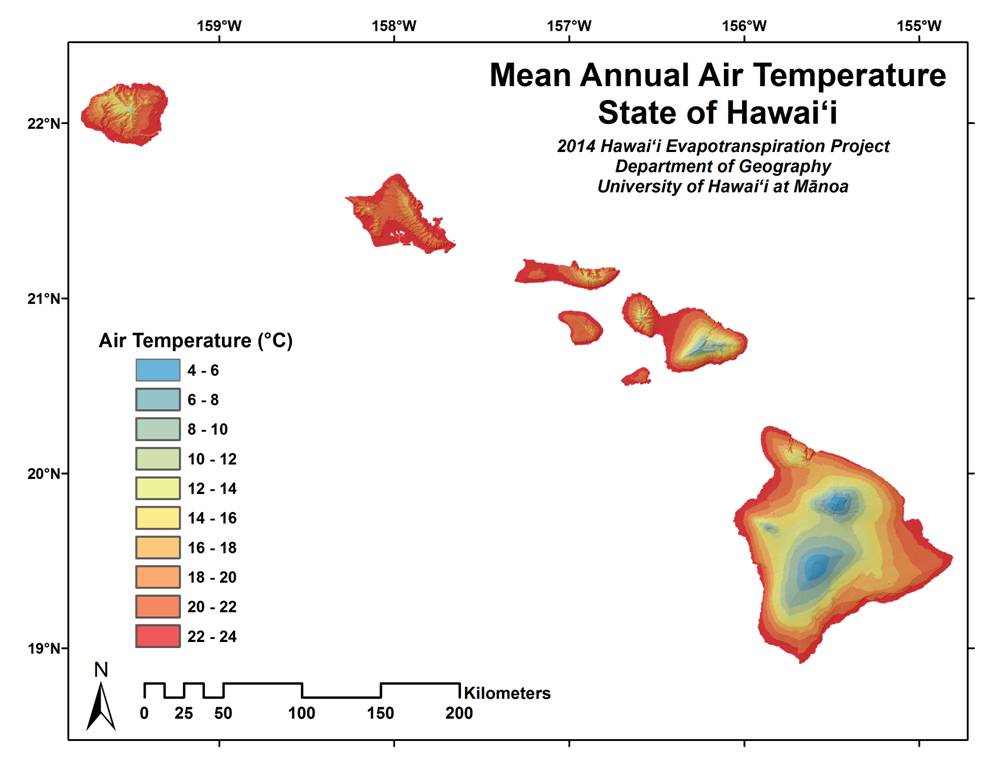
The Climate of Hawai‘i website provides access to a set of maps of the spatial patterns of climate, as well as evapotranspiration (ET), potential evapotranspiration (PET), and land characteristic variables for the major Hawaiian Islands. In general, each variable is presented in the form of mean hourly maps for each hour of the diurnal cycle of each month and of the whole year, mean monthly maps for each month, and a mean annual map. The maps represent our best estimates of the mean values of each variable based on observations taken during the past decade or two.
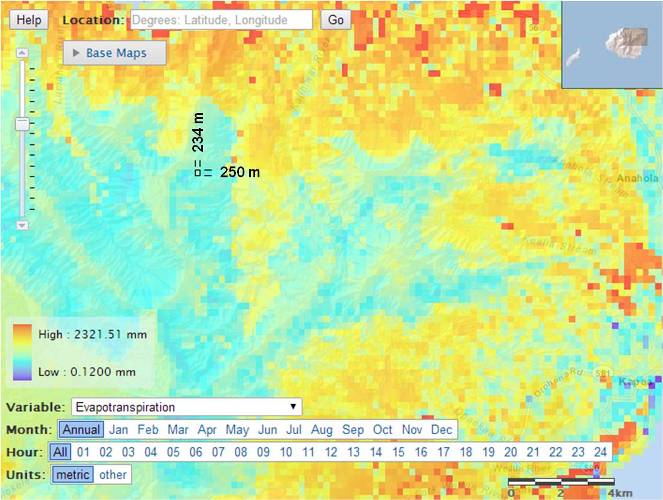
This web site was developed to make the climate maps, data, and related information easily accessible. The maps depict patterns by color. The interactive map allows users to see the spatial patterns of each variable, zoom in on areas of particular interest, navigate to specific locations with the help of a choice of different base maps, and click on any location to get the mean value of the selected variable, graphs of the mean annual cycle (mean monthly values) and mean diurnal cycle (mean hourly values) of the selected variable, and obtain tables of the mean hourly, monthly, and annual values of all variables for the selected location.
The maps can also be downloaded in various forms. Our analysis produced digital maps called rasters or grids. On these maps, the islands are divided into 8.1-arcsecond spatial units, or approximately 234 × 250 m (770 × 820 ft). Each variable is estimated for each spatial unit. GIS (Geographic Information Systems) users can obtain as raster files. Alternatively, image files showing spatial patterns by color can be downloaded.
This website is part of a family of websites providing data on the climate of Hawai‘i. The Rainfall Atlas of Hawai‘i covers only rainfall. The other three websites each provide data for all variables, but each is presented with a particular focus.